HomeData Science Tests
Data Visualization Skills Test
Test duration:
30
min
No. of questions:
8
Level of experience:
Entry/Mid/Expert

Data Visualization Skills Test

This test helps you identify individuals’ skills like data cleaning, data handling, visualization techniques, and more. Using this test, recruiters can cut their technical screening time by 80%, while L&D professionals can create accurate training need analysis.

A visual representation of data using a segmented pie chart
Capgemini
Deloitte
The United Nations
The United Nations
Fujitsu
The United Nations

Data Visualization Skills Test

It is the act of converting and expressing knowledge and information via the use of visual components like graphs, charts, bars, and maps in order to gain insights. Thanks to its graphical depiction, organizations can examine and comprehend patterns, anomalies, and trends in data.

By using this, individuals can better understand an organization's consumer preferences, essential KPIs, and the success of sales and marketing efforts.

Why use iMocha's Data Visualization skills test?

It enables you to assess potential and existing employees' knowledge about various tools, techniques, bug-fixing issues, and more. All the questions of this test are EEOC's complaint to conduct bias-free talent initiatives.

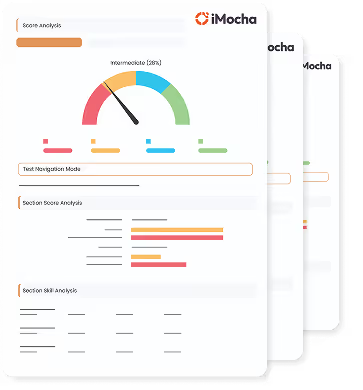
Furthermore, its AI-powered test reporting feature allows one to analyze candidates' responses and get insightful information about their proficiency level to make data-driven talent decisions.

Wondering what other skills we have in our World’s Largest Skills Assessment library?
Visit here
How it works

Test Summary

This skills assessment test helps to screen candidates who possess the following traits:

  • Basic understanding of different data types and data handling concepts
  • Knowledge of visualization techniques like Histograms, Heat Maps, Pie Charts, Timelines, etc.
  • Data cleaning ability to remove or fix corrupted or incorrect data within a data set.
  • Data pre-processing skills to convert raw data into an understandable format.
  • Familiarity with various tools such as Power BI, Tableau, Infogram, Domo, FusionChars, etc.
  • Data storytelling skills to effectively communicate insights using visual narratives.

Whether you are looking to hire or upskill entry-level individuals or senior-level experts, this test can help you find the best match for the job. This test also features multiple anti-cheating measures, such as window violation, IP address tracking, and image and video proctoring, to ensure the integrity of the assessment.

Useful for hiring
  • Data visualization engineer
  • Data analyst
  • Data scientist
  • Business intelligence analyst
  • Analytics manager
Test Duration
30
min
No. of Questions
8
Level of Expertise
Entry/Mid/Expert
Topics Covered
Shuffle

Shuffle

Shuffle

Shuffle

Shuffle

Sample Question
Choose from our 100,000+ questions library or add your own questions to make powerful custom tests.
Question type
Topics covered
Difficulty

Question:

A helicopter view of the employee's progress
Test Report
You can customize this test by

Setting the difficulty level of the test

Choose easy, medium, or tricky questions from our skill libraries to assess candidates of different experience levels.

Combining multiple skills into one test

Add multiple skills in a single test to create an effective assessment and assess multiple skills together.

Adding your own
questions to the test

Add, edit, or bulk upload your coding, MCQ, and whiteboard questions.

Requesting a tailor-made test

Receive a tailored assessment created by our subject matter experts to ensure adequate screening.
FAQ
How is the data visualization skills test customized?
Down Arrow Circle

This test can be customized to test candidates for job-specific skills like visual design, data handling, data analysis, visualization tools and techniques, mathematical and artistic skills, data storytelling, and more. You can also choose which questions to include in the test or ask us to create personalized assessments according to your requirements.

What are the most common interview questions for this position?
Down Arrow Circle

Some of the common questions asked for this role, are:  

  • What are the best practices to ensure data consistency and accuracy in data visualizations?  
  • How would you define depth cueing?  
  • What are the different data validation techniques?  
  • What do you know about Tableau Data Server?  

If you need more customized questions for this role, iMocha can help!  

What are the required skill sets of a data visualization engineer?
Down Arrow Circle

Some common hard and soft skills you can consider while hiring individuals in this role are:  

Hard Skills:  

  • Data Analysis  
  • Data Accuracy  
  • Feedback Incorporation  
  • Mathematical and Statistical skills  
  • Familiarity with Programming Languages  

Soft Skills:  

  • Good Communication Skills  
  • Critical Thinking  
  • Storytelling  
  • Adaptability