HomeData Science Tests
Matplotlib Test
Test duration:
20
min
No. of questions:
10
Level of experience:
Entry/Mid/Expert

Matplotlib Test

Our online Matplotlib test is the preferred pre-employment test for recruiters and hiring managers to hire job-fit candidates for roles such as Data Analyst in Python, Python Developer Data Science Developer, Python ML Automation Developer, PySpark Developer, and Image Processing Engineer. The test also helps enterprises to reduce hiring costs by 40%.

A circular diagram with multicolored triangles arranged in a radial pattern
Capgemini
Deloitte
The United Nations
The United Nations
Fujitsu
The United Nations

Matplotlib Online Test

Matplotlib is a library known for its comprehensiveness in creating static, animated, and interactive visualizations in Python. Matplotlib has the significant quality of making easy things easy and hard things possible. Matplotlib also ships with several add-on toolkits, including 3D plotting with mplot3d, axes helpers in axes_grid1, and axis helpers in axis_artist.

Matplotlib test (Python v3) helps tech recruiters and hiring managers to assess candidates’ data visualization skills with Matplotlib. The Matplotlib skills test is designed by experienced Subject Matter Experts (SMEs) to evaluate and hire data analysts in Python as per the industry standards.

Wondering what other skills we have in our World’s Largest Skills Assessment library?
Visit here
How it works

Test Summary

Matplotlib test helps to screen the candidates who possess traits as follows: 

  • Strong knowledge of Matplotlib library and its functions.
  • Knowledge of using different plots like Bar plots, Stacked Bar charts, Stem plots, Horizontal Bar plots, etc.
  • Experience in handling other modules used in the Matplotlib library.
  • Familiarity with terms like Coherence, Subplot Projection Dimension, and Axes Share.

Matplotlib test has a robust reporting feature that will help you get an instant result and share this result with your recruiting team. You can use a ready-to-use assessment or ask us to custom-make the skills assessment per your job description.

This test may contain MCQs (Multiple Choice Questions), Fill in the Blanks, Whiteboard Questions, Audio / Video Questions, AI-LogicBox (Pseudo-Coding Platform), Coding Simulators, True or False Questions, etc.

Useful for hiring
  • Data Analyst in Python
  • Python Developer
  • Data Science Developer
  • Python ML Automation Developer
  • PySpark Developer
  • Image Processing Engineer
Test Duration
20
min
No. of Questions
10
Level of Expertise
Entry/Mid/Expert
Topics Covered
Shuffle

Autocorrelation Plot

Our Matplotlib test assesses the candidate's knowledge of the Autocorrelation plot to check randomness in the data set

Bar Plot

The Matplotlib skills test evaluates a candidate's knowledge to compare things between different groups or to track changes over time
Shuffle

Stacked Bar Chart

iMocha's test assesses knowledge on Stacked Bar Chart to compare data categories and visualizing their composition
Shuffle

Stem Plot

The Matplotlib assessment evalautes candidate's knowledge on Stem plot to extract high value, low value and their placement
Shuffle

Horizontal Bar Plot

The tech assessment contains questions to check candidate's understanding plotting a horizontal bar in Matplotlib
Shuffle

Contour Plot

The Matplotlib test assesses candidate's knowledge of for doing multivariate analysis and visualizing 3-D plots in 2-D space
Sample Question
Choose from our 100,000+ questions library or add your own questions to make powerful custom tests.
Question type
Multiple Option
Topics covered
Matplotlib
Difficulty
Hard

Question:

You are trying to plot a bar chart on a polar axis with given colors for every bar. You want to set the intensity of colors to 0.5. Which of the following is the correct way to do so?
Refer to the given sample bar chart on the polar axis with a color intensity of 0.5.


Bar chart image


Options

  • polar_bar(theta, radii, width=width, color=colors, alpha=0.5)
  • bar(theta, radii, width=width, color=colors, alpha=0.5)
  • bar(theta, radii, width=width, color=colors, intensity=0.5)
  • polar_bar(theta, radii, width=width, color=colors, intensity=0.5)
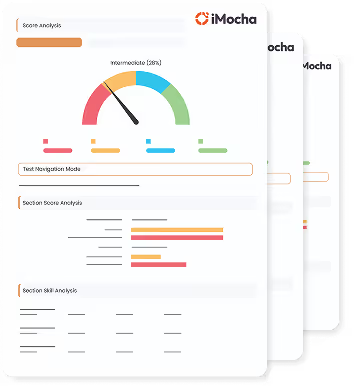
A helicopter view of the employee's progress
Test Report
You can customize this test by

Setting the difficulty level of the test

Choose easy, medium, or tricky questions from our skill libraries to assess candidates of different experience levels.

Combining multiple skills into one test

Add multiple skills in a single test to create an effective assessment and assess multiple skills together.

Adding your own
questions to the test

Add, edit, or bulk upload your coding, MCQ, and whiteboard questions.

Requesting a tailor-made test

Receive a tailored assessment created by our subject matter experts to ensure adequate screening.
FAQ